Celebration of Scholars
#05: Investigating Diversity, Equity, and Inclusion in Statistics and Data Science Courses
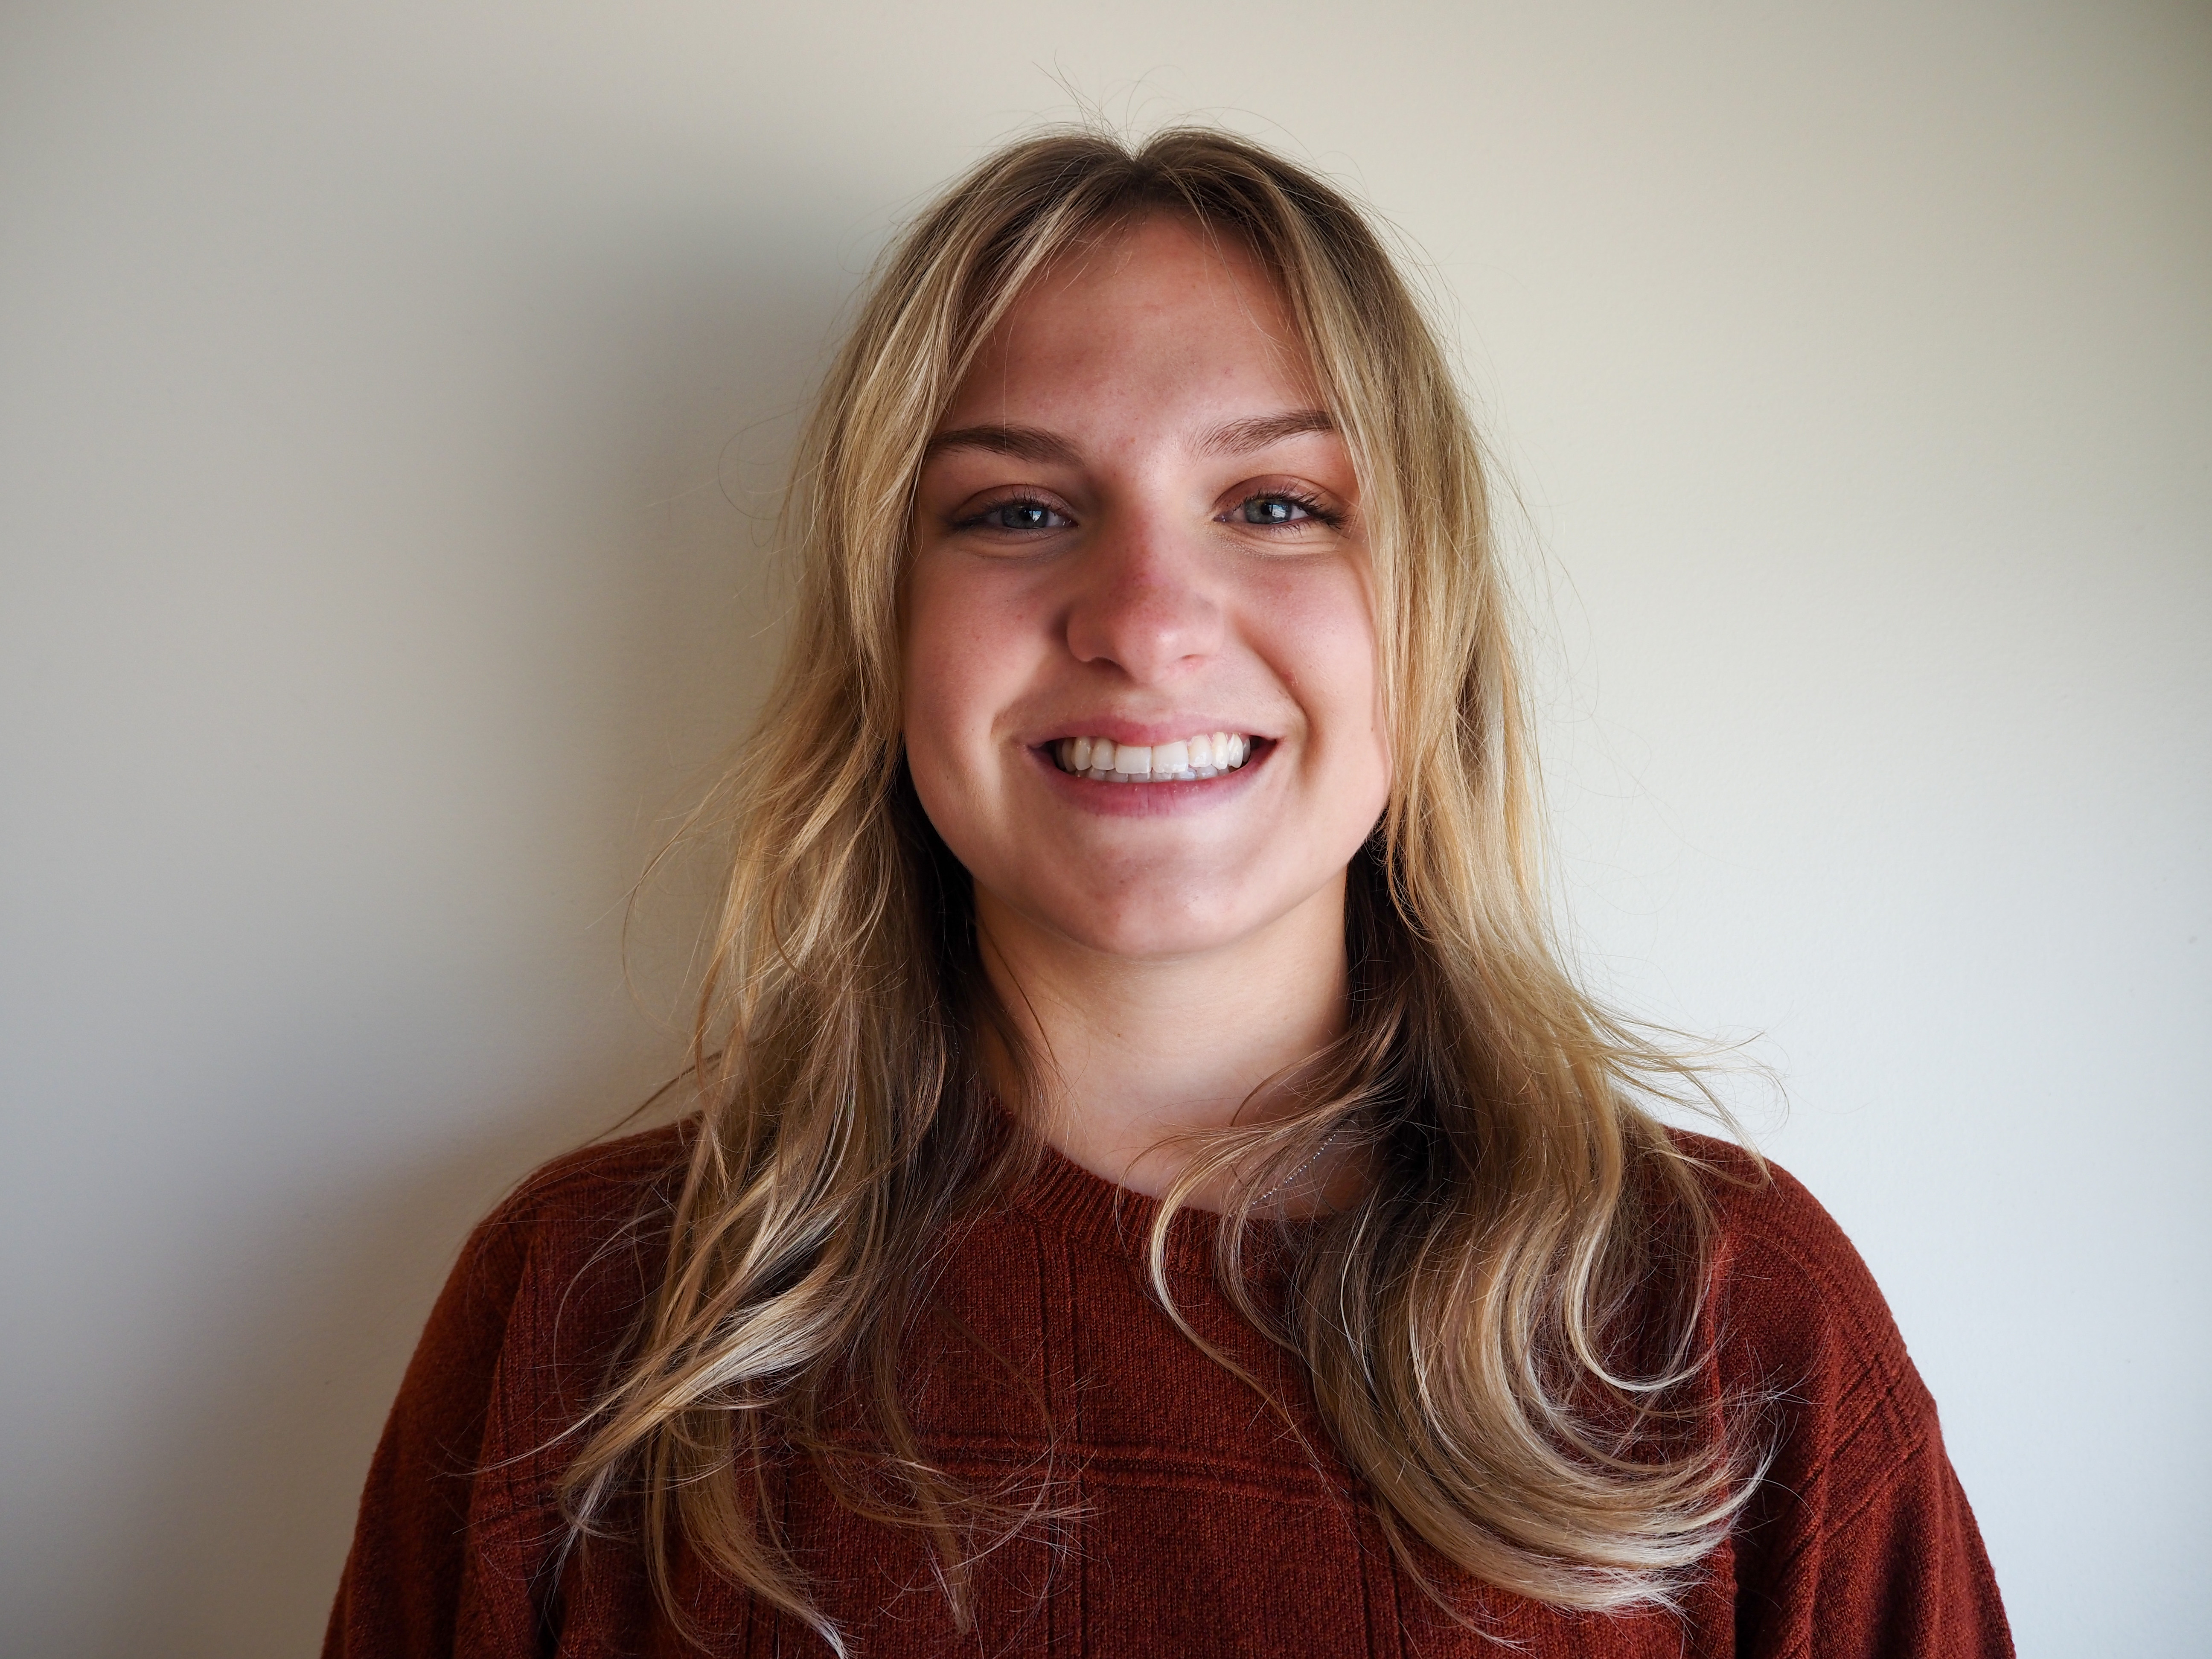
 Name:
Elizabeth Rahmel
Major: Mathematics
Hometown: Hartland, WI
Faculty Sponsor: Diana Thomson
Other Sponsors: Sara Jensen, Haley Yaple
Type of research: SURE
Funding: SURE
 Name:
Jordan Ball
Major: Computer Science
Hometown: Twin Lakes, WI
Faculty Sponsor: Diana Thomson
Other Sponsors: Sara Jensen, Haley Yaple
Type of research: SURE
Funding: SURE

Major: Mathematics
Hometown: Chisago Lakes, MN
Faculty Sponsor: Diana Thomson
Other Sponsors: Sara Jensen, Haley Yaple
Type of research: SURE
Funding: SURE
Abstract
In August 2020, the Kenosha community, home of Carthage College, was devastated after the shooting of Jacob Blake and the ensuing protests. Issues of inequality and racism have been at the forefront nationally in recent years and data is one of the most useful tools to quantify inequity and injustice. Our research group spent the summer of 2021 working towards a plan to incorporate such data into the statistics and data science classrooms. We began by curating and cleaning real-world data sets that fit our DEI theme. Examples include data related to COVID-19 vaccination status, fatal police shootings, income by sex, and more. Then we evaluated and analyzed those data sets as students would in Carthage’s Elementary Statistics class. We developed lesson plans and researched best pedagogical practices, such as creating “Principled Space” and how to facilitate productive and engaging classroom discussions. Finally, we developed survey methods to measure our impact. This social-justice-oriented curriculum was implemented into a new course, Statistics for Social Justice, during the Spring 2022 semester. Exposing Carthage students to concrete examples of social justice issues may have significant benefits, including making class content more relatable, improving students’ technical skills, and showcasing the power of quantitative literacy and analysis, all while emphasizing the need for change in our society.Submit date: April 1, 2022, 11:20 p.m.
